


1
2
3
4
5
6
7
8
9

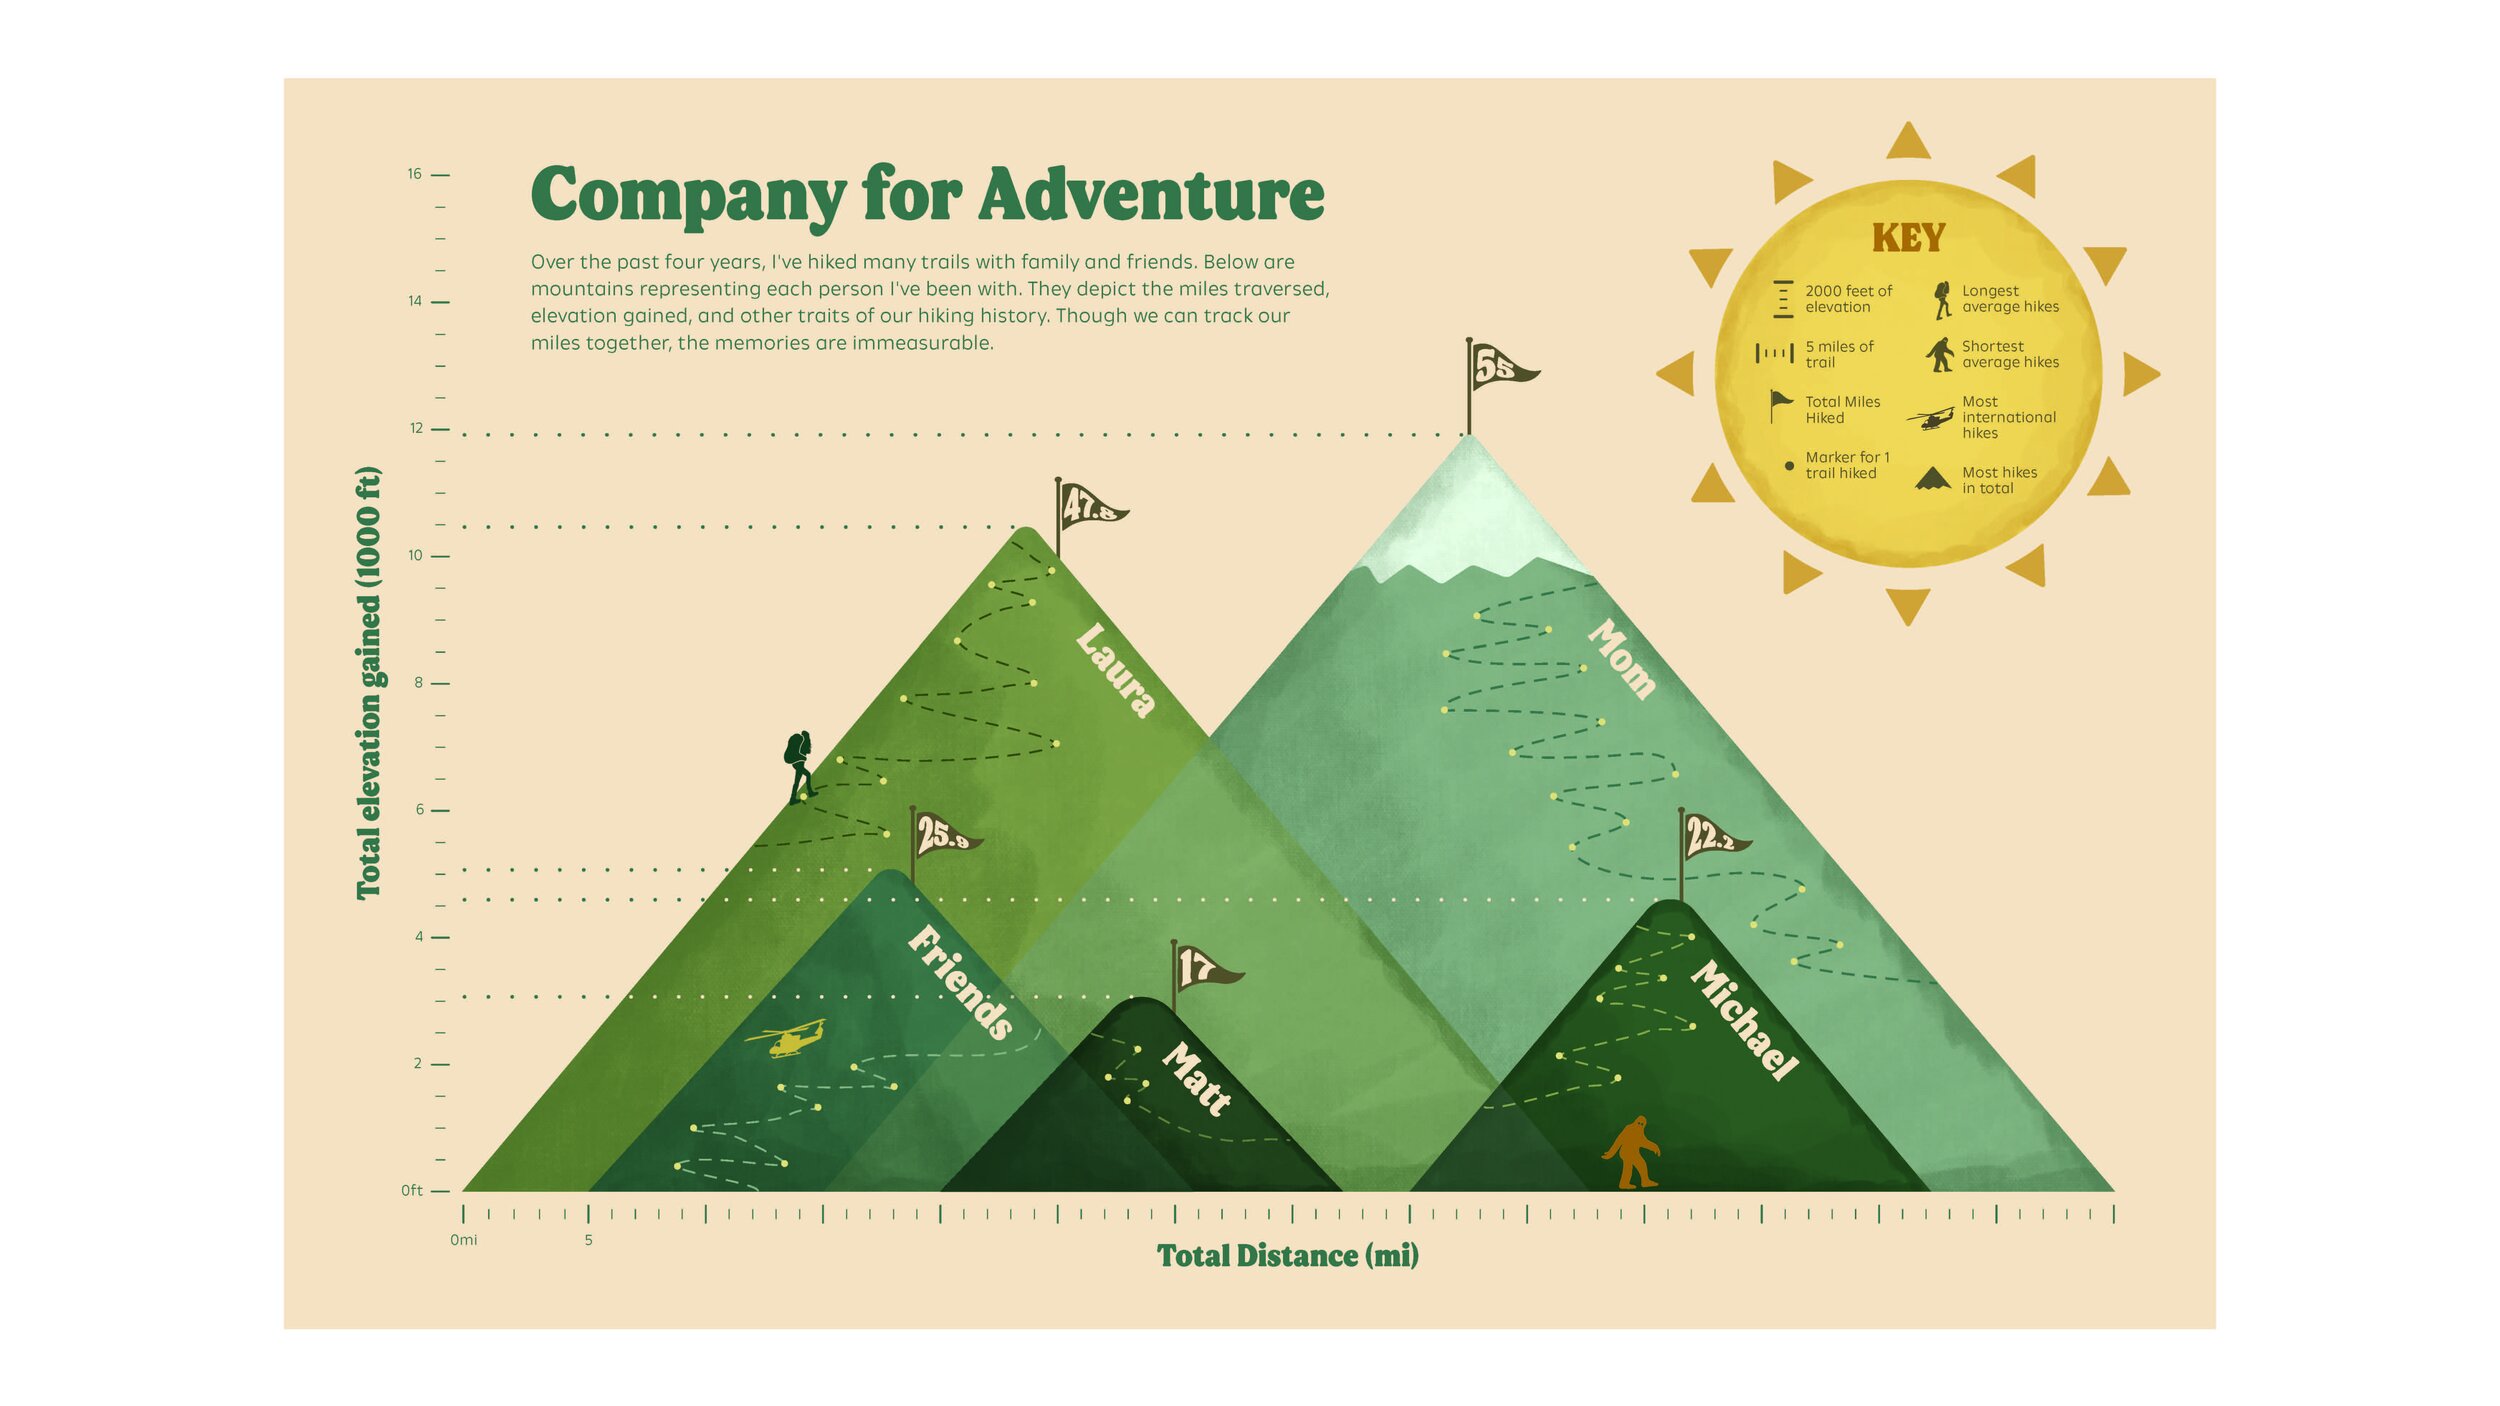
Joelle Klouda
Company for Adventure is an illustrated graph that used mountains to depicts how far I have hiked with family and friends. With each mountain representing a different person, the x-axis represents total miles hiked while the y-axis refers to the total elevation gained in feet. There are illustrations such as big foot, helicopters, mile markers, and flags around the mountains that show other achievements with that person like longest and shortest average hikes, most international hikes, and total most amount of hikes.
Olivia Kriley
This comprehensive map documents the films I’ve seen in movie theaters over the past decade, represented through data visualization. The map details both the physical and emotional attributes of each entry with a key that allows viewers to follow the trail of information.
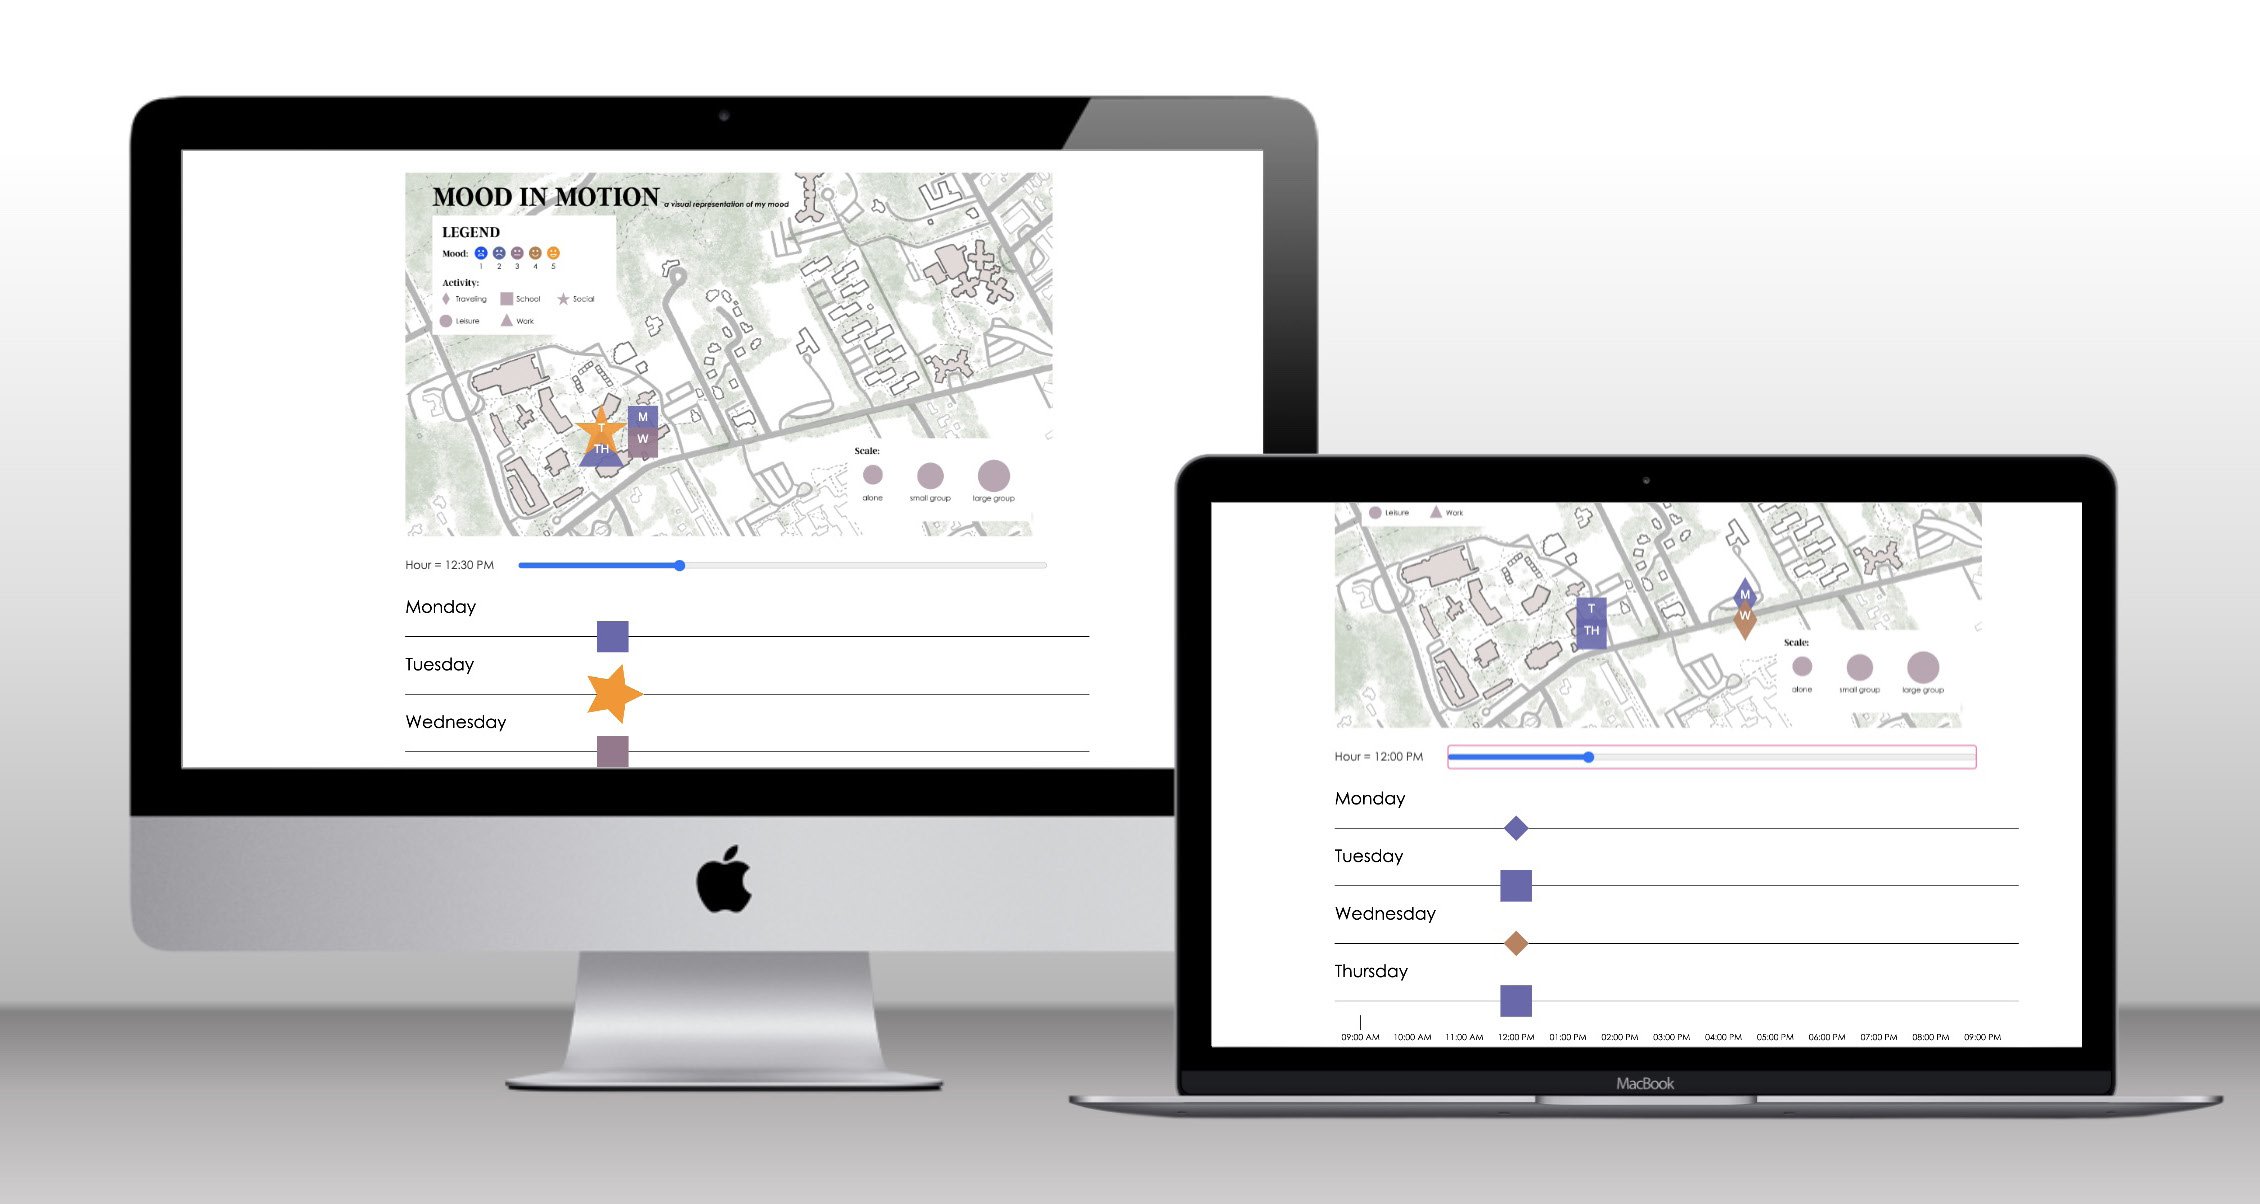
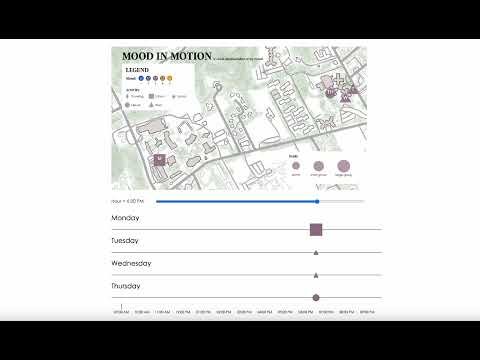
Anna Leonard
Mood in Motion is an interactive map that visualizes my mood over four days, from 9 AM to 9 PM. I coded it using Glitch, combining D3 and P5 libraries for this project. The map features my original drawing. I also created horizontal bars underneath the map as an alternative way to visualize the data. View my project below!
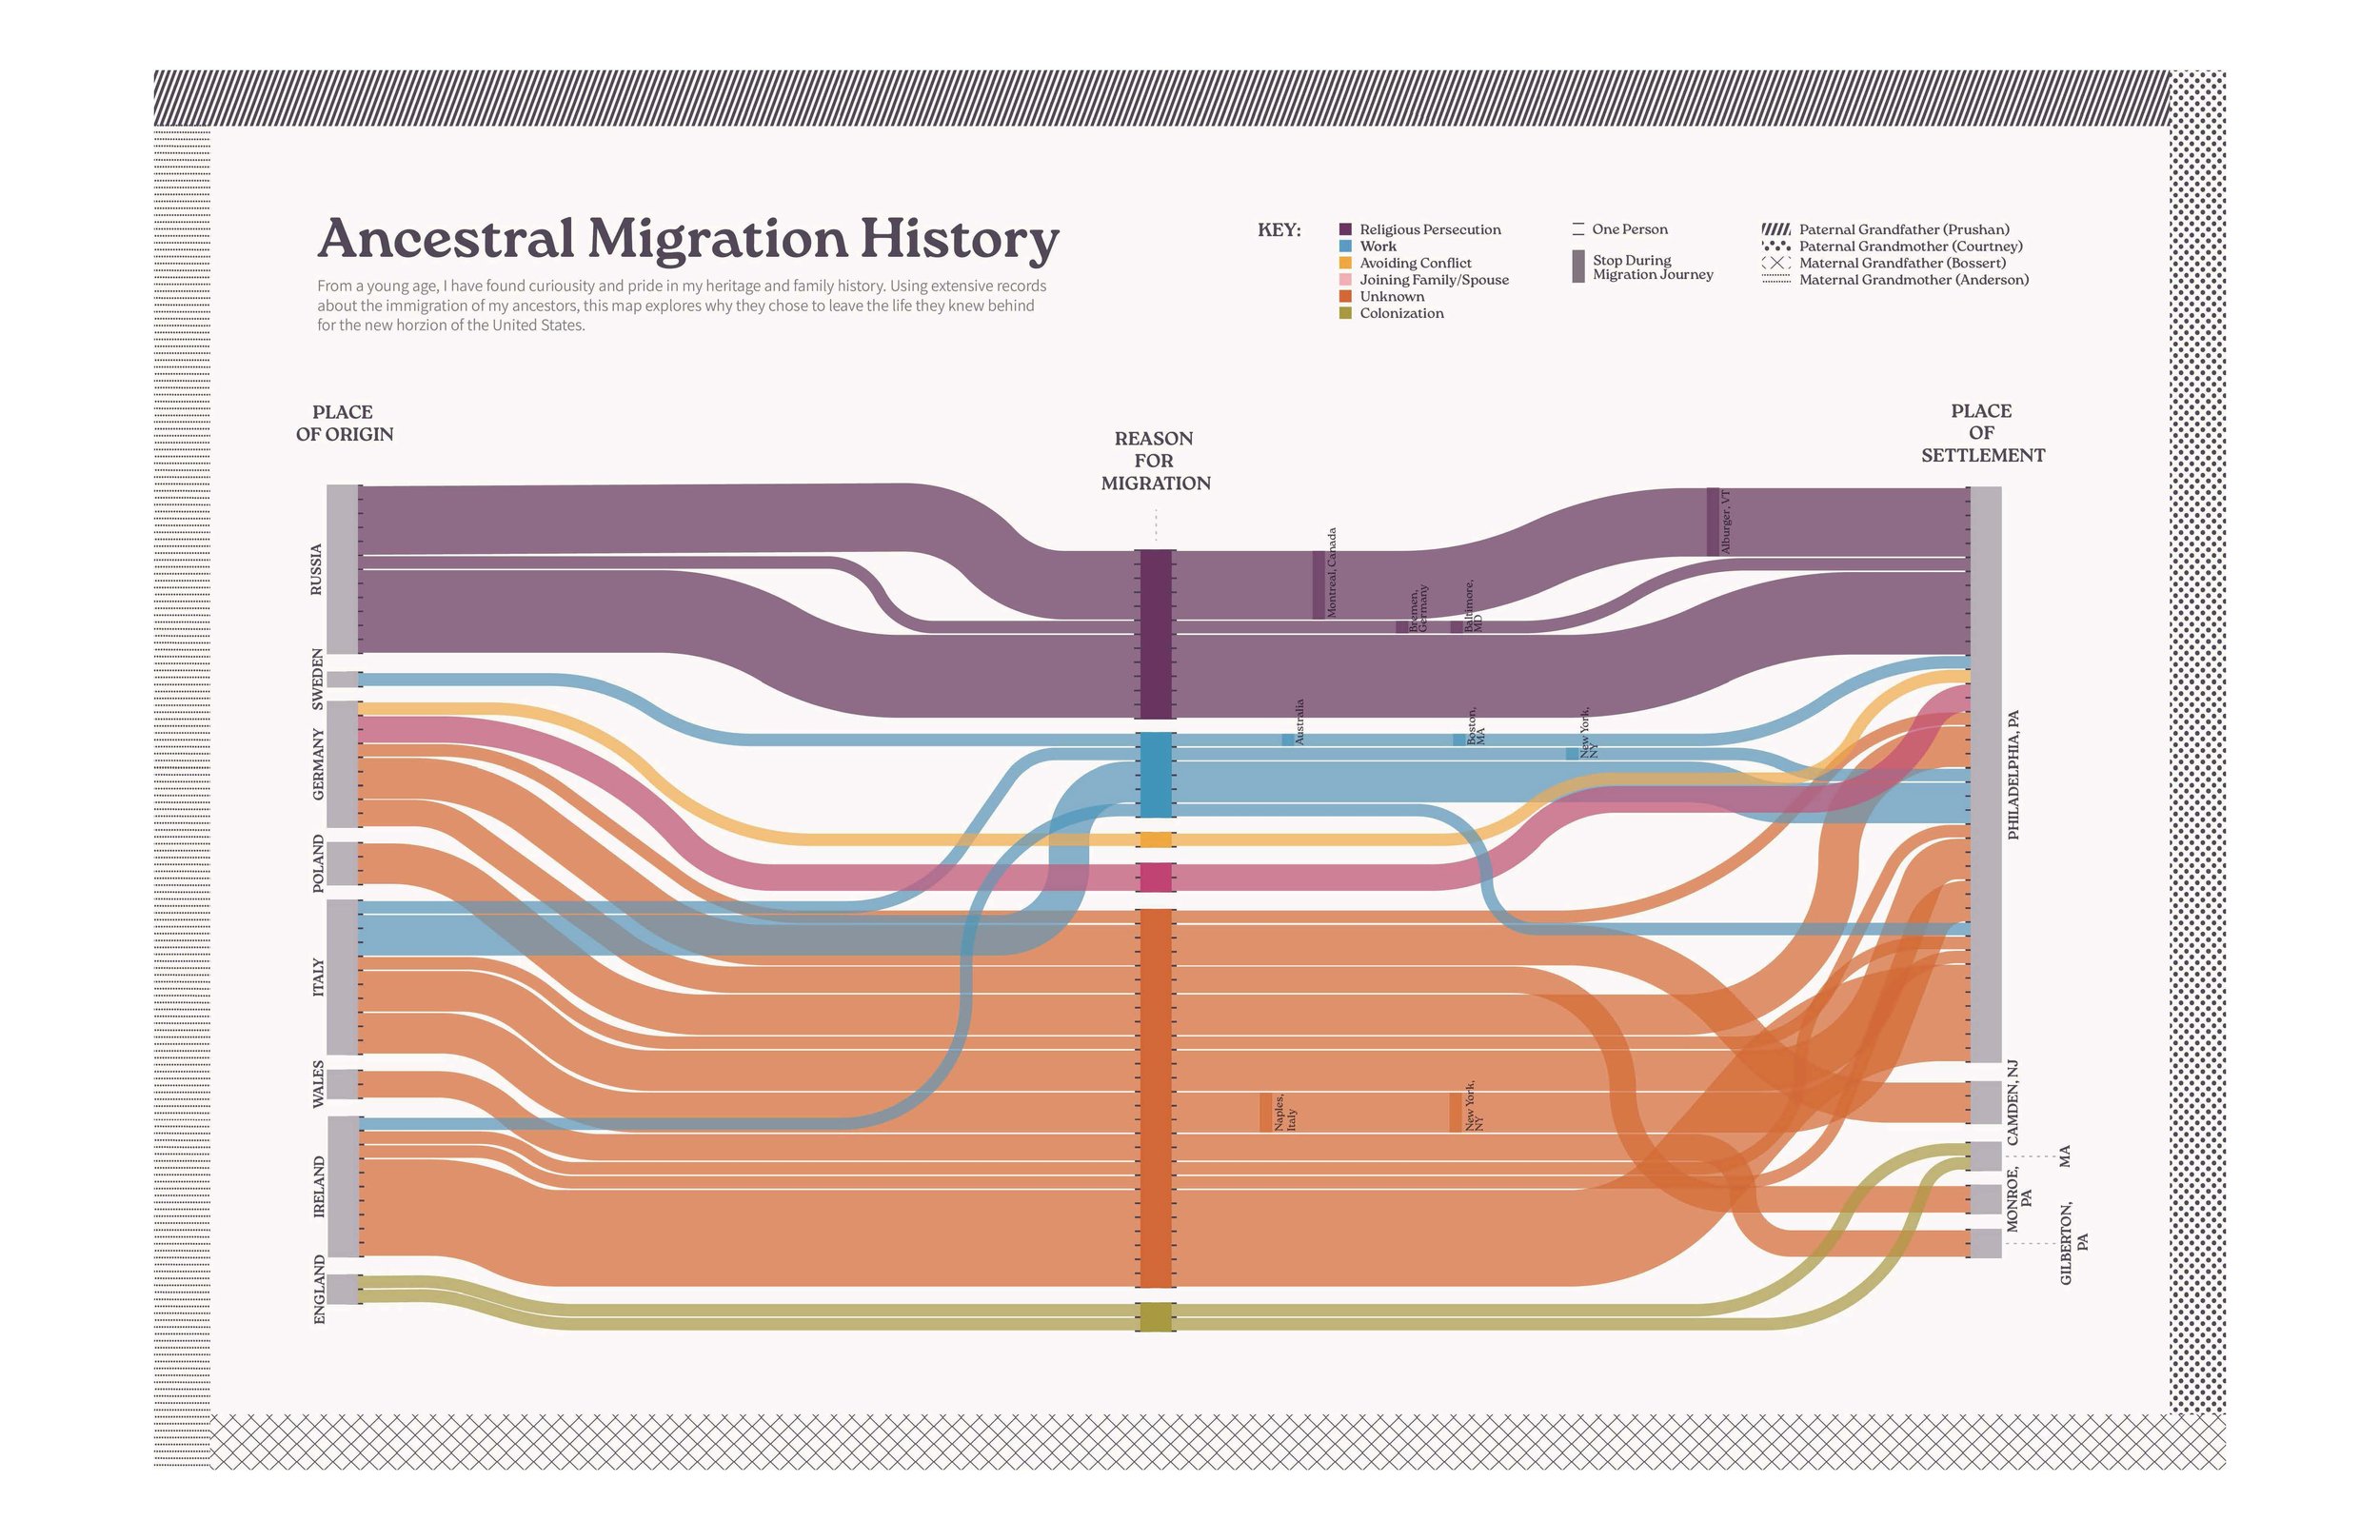
Emma Prushan
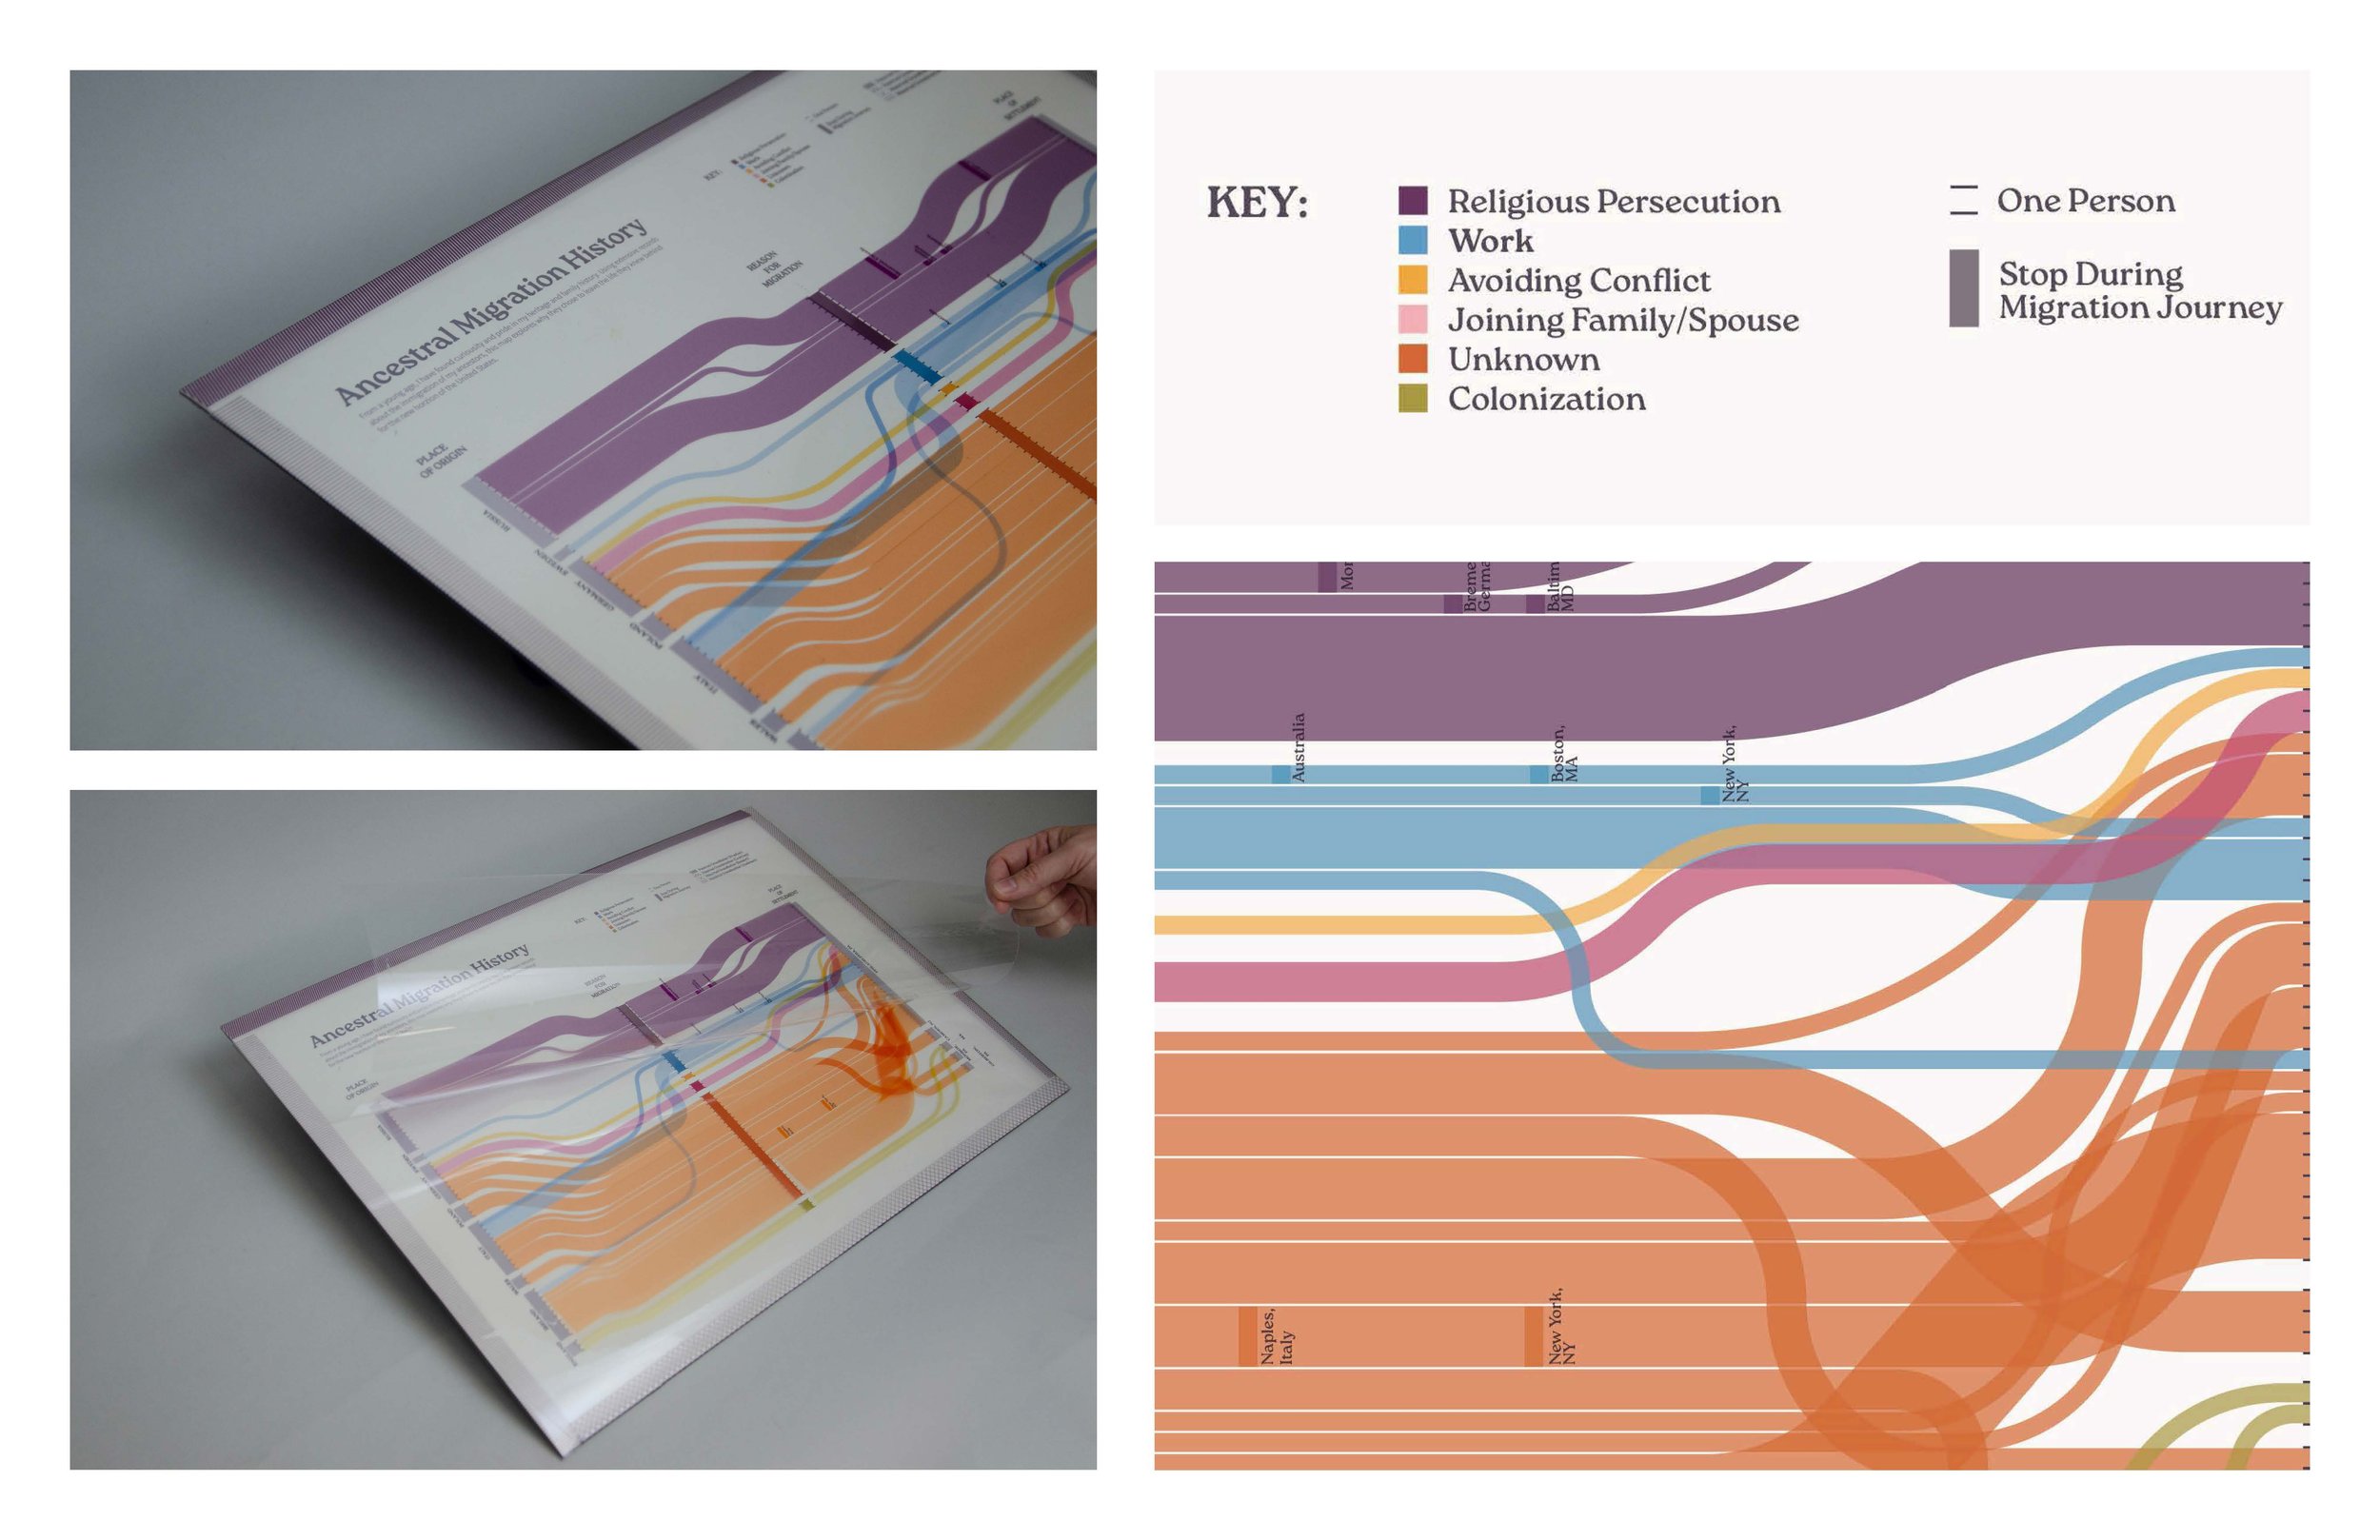
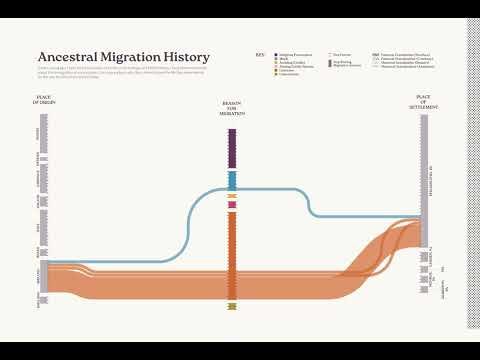
Inspired by my family’s in-depth records about our ancestors, I created an alluvial diagram documented the migration of my ancestors to the United States. I chose to focus on their reason for migration, revealing intriguing comparisons between the sides of my family. In order to highlight these diverse histories, I integrated layers of transparencies into the physical production of my map. Each transparent layer focuses on a side of my family (paternal grandmother, maternal grandfather, etc.), showcasing both where my ancestors originated from and their unique stories.
Emma Prushan
Inspired by my family’s in-depth records about our ancestors, I created an alluvial diagram documented the migration of my ancestors to the United States. I chose to focus on their reason for migration, revealing intriguing comparisons between the sides of my family. In order to highlight these diverse histories, I integrated layers of transparencies into the physical production of my map. Each transparent layer focuses on a side of my family (paternal grandmother, maternal grandfather, etc.), showcasing both where my ancestors originated from and their unique stories.
Annika Zitto
Based on my personal opinion and experiences, I rated each city on nine different topics using a 5-point scale. Using a triangle to represent each category, I created this display of my city rankings. Based on the size of the different triangles and their individual vertices you can see, at a glance, which cities I value for which aspects.
To go along with this, I created a template for people to rate cities themselves. This template allows for reflection on what makes you like a place and the elements truly matter to you.